
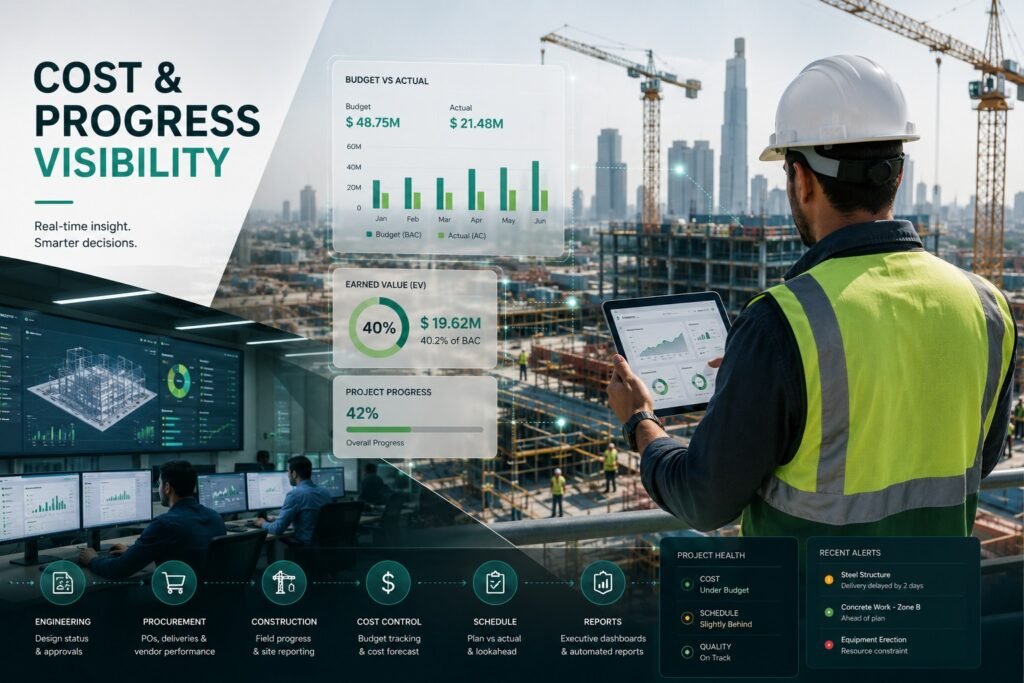
What if your leadership team could detect the warning signs 30–60 days earlier?
- One delayed procurement package can affect construction schedules.
- One design change can trigger cost escalation.
- One cash-flow issue can impact an entire project portfolio.
Engineering, Procurement and Construction (EPC) companies operate some of the world’s most complex projects. Whether it’s highways, industrial plants, airports, metro rail, renewable energy, or oil & gas facilities, every project involves thousands of interconnected activities. Schedule slippage, procurement delays, rising costs, subcontractor performance issues, and cash-flow bottlenecks hardly occur overnight
They develop gradually, hidden across spreadsheets, disconnected reports, and siloed systems
That is exactly what a Construction Risk Monitoring Dashboard is designed to achieve.
A modern Construction Risk Monitoring Dashboard transforms fragmented project data into a single source of truth, helping leadership teams detect risks before they escalate into million-pound—or million-rupee—losses.
Key Features of an EPC Risk Monitoring Dashboard
An effective Construction Risk Analytics platform should provide:
- Real-Time Executive Dashboard
Monitor every active project through one executive dashboard.
- Risk Heat Map Dashboard
Visualize project risks based on severity, probability, and business impact.
- Predictive Construction Risk Analytics
Use historical trends and AI-driven insights to forecast future project risks.
- Delay Prediction Dashboard
Identify schedule slippage weeks before milestones are missed.
- Cash Flow Monitoring
Track forecast versus actual cash flow across projects.
- Project Health Index
Measure overall project performance using integrated KPIs.
- Portfolio Risk View
Monitor hundreds of projects from one central location.
Why Traditional Risk Management Is No Longer Enough
- Earlier Risk Detection
Identify issues before they affect project profitability.
- Faster Executive Decisions
Leadership teams receive accurate information without waiting for manual reports.
- Improved Portfolio Visibility
Track multiple projects through one executive dashboard.
- Better Resource Planning
Allocate manpower and equipment based on project priorities.
- Reduced Cost Overruns
Monitor budget deviations before they become financial losses.
- Improved Client Confidence
Transparent reporting strengthens relationships with clients and stakeholders.
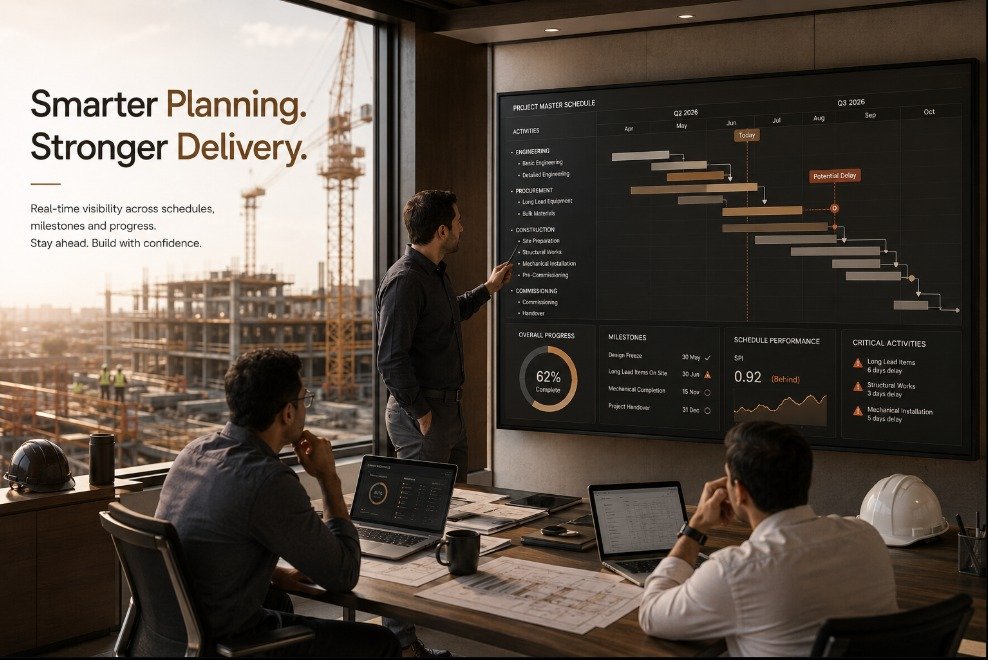
A modern Construction Risk MonitoringDashboard transforms this reactive approach into proactive decision-making by consolidating schedule, cost, progress, procurement, cash flow, and risk indicators into a single executive view
Benefits of Digital Risk Monitoring for EPC Projects
- Earlier Risk Detection
Identify issues before they affect project profitability.
- Faster Executive Decisions
Leadership teams receive accurate information without waiting for manual reports.
- Improved Portfolio Visibility
Track multiple projects through one executive dashboard.
- Better Resource Planning
Allocate manpower and equipment based on project priorities.
- Reduced Cost Overruns
Monitor budget deviations before they become financial losses.
- Improved Client Confidence
Transparent reporting strengthens relationships with clients and stakeholders.
How IBGC Helps EPC Companies Stay Ahead of Risk
At IBGC, we understand that project success depends on timely decisions backed by reliable data.
Our Construction BI solutions unify:
- Schedule
- Cost
- Progress
- Cash Flow
- Procurement
- Resource Performance
- Risk Indicators
- Executive KPIs
Into a single executive dashboard that empowers project leaders to identify risks early, act faster, and maintain stronger control across the entire project portfolio.
How to implement a Construction Risk Monitoring Dashboard.
- Scope and goals: Define the key risks to monitor, stakeholders, and target KPIs.
- Data mapping: Inventory systems (ERP, scheduling, sensors) and define integration points.
- Minimum Viable Dashboard: Build a focused dashboard for top 3–5 KPIs and risk heatmap.
- Pilot on one project: Validate alerts, scoring, and workflows on a single EPC or infrastructure project.
- Iterate: Add data sources, refine predictive models, and tune thresholds.
- Scale: Roll out standardized dashboards across projects with role-based templates.
- Governance: Establish data owners, escalation rules, and review cadences.
Implementation pitfalls to avoid.
- Overcomplicating the first release with every metric.
- Ignoring data quality — garbage in, garbage out.
- Not involving frontline users (planning, procurement, site teams) early.
- Treating the dashboard as reporting only, not a decision tool with workflows.
- Failing to align risk scores to commercial decisions (contingency drawdowns, claims strategy).
Whether you manage highways, rail, industrial plants, renewable energy, water, or commercial infrastructure projects, IBGC’s dashboards provide the visibility needed to reduce uncertainty and improve project outcomes. Organization’s that embrace predictive analytics, AI-driven risk monitoring, and executive dashboards gain a competitive advantage through faster decisions, stronger governance, and more predictable project outcomes.
If your teams still rely on spreadsheets and static reports, now is the time to move towards intelligent, real-time project controls.
Detect Risks Before They Become Costly Delays
Gain complete visibility across schedule, cost, progress, cash flow, procurement, and project performance with IBGC’s intelligent Construction Risk Monitoring Dashboard.